Sunday, September 8, 2024
Banking QuizQuant

Quantitative Aptitude: Data Interpretation Set 4

Directions (1 – 5): A survey is taken in 6 cities of a state. The pie chart shows the distribution of people in each city with total 8,40,000 people.

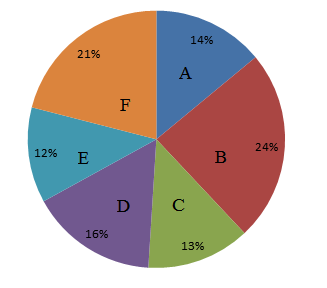
  1. Number of people in city B is how much percent greater than the number of people in city D?
    A) 8%
    B) 50%
    C) 15%
    D) 35%
    E) 42%
    View Answer
    Option B
    Solution:

    A = 117600, B = 201600, C = 109200, D= 134400, E = 100800, F = 176400
    So here – [(201600-134400)/134400] × 100 = 50%
  2. What is the total number of people in cities C, E and F?
    A) 3,86,400
    B) 3,45,670
    C) 3,24,500
    D) 3,67,400
    E) 3,66,400
    View Answer
    Option A
    Solution:

    A = 117600, B = 201600, C = 109200, D= 134400, E = 100800, F = 176400
  3. What is the ratio between number of people in cities F and C together and that in B and E together?
    A) 16 : 17
    B) 15 : 22
    C) 17 : 20
    D) 17 : 18
    E) 18 : 23
    View Answer
    Option D
    Solution:

    A = 117600, B = 201600, C = 109200, D = 134400, E = 100800, F = 176400
    176400 + 109200 : 201600 + 100800
    2856 : 3024
    17 : 18
  4. If there are 65% males in city B, 49% females in city D and 47% males in city E, then females in these cities form what percent of total number of people in these three cities?
    A) 52.33%
    B) 45.37%
    C) 32.56%
    D) 44.08%
    E) None of these
    View Answer
    Option D
    Solution:

    A = 117600, B = 201600, C = 109200, D = 134400, E = 100800, F = 176400
    Females in B, D, and A = 35/100 × 201600 + 51/100 × 134400 + 53/100 × 100800 = 192528
    So % = [192528/(201600+134400+100800)] × 100 = 44.08%
  5. Number of people in city A is what percent of the number of people in city C?
    A) 111.91%
    B) 123.25%
    C) 107.69%
    D) 119.31%
    E) 126.22%
    View Answer
    Option C
    Solution:

    14/13 × 100

Directions (6- 10): Study the following carefully and answer the questions that follow:
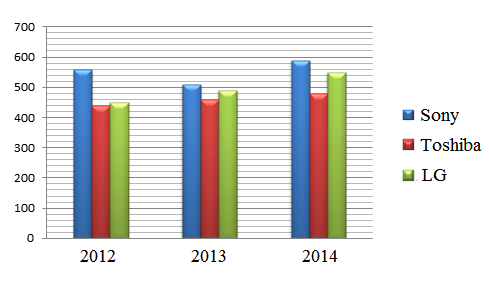
The bar graph shows the number of sales of Televisions (in Thousands) each year by three companies in 3 consecutive years.

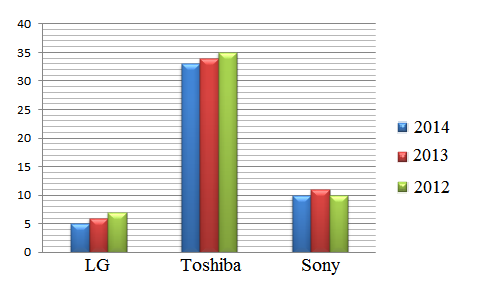
The line chart shows the average price per television (in Thousands Rupees) for these three consecutive years.

  1. How much money (in million) did Toshiba make for the year 2013?
    A) 19800
    B) 18260
    C) 12700
    D) 15640
    E) 12330
    View Answer
    Option D
    Solution:

    In 2013, Toshiba sold = 460 thousand
    Average price in 2013 is Rs 34
    So total money is (34 × 460) million
  2. What is the average number of Televisions sold per year over the given three years?
    A) 1680
    B) 1430
    C) 1560
    D) 1400
    E) 1510
    View Answer
    Option E
    Solution:

    Sold in 2012 = 560+440+450 = 1450
    Sold in 2013 = 510+460+490 = 1460
    Sold in 2014 = 590+480+550 = 1620
    Total number sold in 3 years = 1450+1460+1620 = 4530
    So average = 4530/3 = 1510
  3. What percent of total money generated by selling Televisions from Toshiba in 2014?
    A) 61%
    B) 64%
    C) 52%
    D) 78%
    E) 56%
    View Answer
    Option B
    Solution:

    Total money generated in 2014 by selling all = 590*10 + 480*33 + 550*5 = 24490 million
    Total money generated in 2014 by selling Toshiba only = 480*33 = 15840 million
    So % = [15840/24490] × 100 = 64%
  4. What is the percent change in the average price of television in the year 2013 compared to the year 2012?
    A) 1.9% increased
    B) 2.9% decreased
    C) 1.9% decreased
    D) 2% increased
    E) 3.0% decreased
    View Answer
    Option C
    Solution:

    Avg price in 2012 = (10+35+7)/3 = 17.33
    Avg price in 2013 = (11+34+6)/3 = 17
    So % change = [(17.33-17)/17.33] × 100 = 1.9% decreased
  5. If in 2015, Sony wants to decrease the average price of its each Television by 10% then how many Televisions they have to sell (in thousands) so that the amount of money generated by selling Televisions remains unchanged compared to the previous year?
    A) 615.60
    B) 655.50
    C) 683.40
    D) 625.40
    E) 643.60
    View Answer
    Option B
    Solution:

    In 2014, avg price of Sony is 10,000
    So in 2015, after decreasing by 10%, price per TV becomes = 90/100 * 10 = Rs 9
    Now, income generated by selling Sony in 2014 = 590*10 = 5900 million
    So in years 2015, no of Sony TV sold is 5900/9 = 655.5 thousand
0