Quantitative Aptitude: Data Interpretation Set 2
Directions (1-5): The following bar graph shows the production (in thousands) of different products in a company in 6 different months.
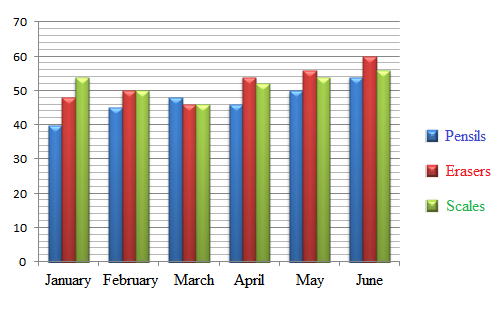
- In how many months in the percentage rise/fall in production of Erasers from the previous month less that 10%?
A) 1
B) 3
C) 4
D) 2
E) None of these
- The production of pencils for the given period is approximately what percentage of the total production of all the three products during the given period?
A) 23%
B) 45%
C) 17%
D) 31%
E) None of these
- What is the difference between the average production of scales in April, May and June and the average production of erasers from January to June?
A) 1.22
B) 1.67
C) 1.97
D) 1.35
E) 1.16
- If in July, the production of pencils get increased by 12%, that of erasers get increased by 8% and that of scales get decreased by 5% over the previous month, find the total production of all the 3 products in July.
A) 123.45 thousand
B) 178.48 thousand
C) 132.56 thousand
D) 142.42 thousand
E) 138.67 thousand
- If selling price of one pencil is Rs 8 and that of one scale is Rs 11, then what is the difference between the revenues of pencils and scales during the given months?
A) 1174 thousand
B) 1438 thousand
C) 1624 thousand
D) 1238 thousand
E) 1168 thousand
Directions (6- 10): Study the following carefully and answer the questions that follow:
A school has a total of 3000 students in 5 different classes as 1, 2, 3, 4, and 5. The ratio of boys to girls in the school is 4 : 2 respectively. 14% of the boys are in class 1. 20% of the girls are in class 5. The ratio of boys to girls in class 1 is 4 : 6 respectively. One-eighth of the girls are in class 3. 44% of the boys are in class 4. Number of girls in class 4 is 20% of the boys in the same class. The reaming girls are in class 2. The total number of students in class 3 is 345. 24% of the boys are in class 2 and the remaining boys are in class 5.
- The total number of students in class 3 is what percent of the total number of students in the school?
A) 12.0%
B) 12.5%
C) 11.5%
D) 13.2%
E) 15.5%
- How many boys are there in class 5?
A) 98
B) 143
C) 130
D) 140
E) 116
- The number of boys in class 5 is what percent of the number of boys in the school?
A) 5%
B) 7%
C) 3%
D) 4%
E) 6%
- Find the total number of girls In class 3 and class 4?
A) 291
B) 315
C) 303
D) 301
E) 296
- The number of girls in class 1 is what percent of the total number of girls in the school?
A) 44%
B) 47%
C) 41%
D) 42%
E) 48%